FOCUS ON AG
May 2, 2022
MUCH IMPROVED FARM INCOME LEVELS IN 2021
The University of Minnesota recently reported that the average net farm income for Southern Minnesota farmers in 2021 was $280,900, which was at the highest level since 2012. The very positive 2020 and 2021 net farm income levels followed seven years in a row(2013-2019) of sup-par net farm income levels in the region. The 2021 net farm income levels in Southern and West Central Minnesota were enhanced by robust crop profits that resulted from average to above average crop yields and the highest grain market prices since 2013. Livestock profit margins in 2021 in Southern Minnesota were also mainly positive; however, the profit levels were at much more modest levels than the crop profits.
The Farm Business Management (FBM) Summary for Southern and West Central Minnesota is prepared by the Farm Business Management Instructors. This summary includes an analysis of the farm business records from farm businesses of all types and sizes in Southern and Western Minnesota. This annual farm business summary is probably one of the best gauges of the profitability and financial health of farm businesses in the region on an annual basis. Following are some of the key points and data that were in the 2021 FBM Summary:
BACKGROUND DATA • The “Net Farm Income” is the return to labor and management, after crop and livestock inventory adjustments, capital adjustments, depreciation, etc. have been accounted for. This is the amount that remains for family living, non-farm capital purchases, income tax payments, and for principal payments on farm real estate and term loans.
The “median” net farm income is the midpoint net farm income of all farm operations included in the FBM Summary, meaning that half of the farms have a higher net farm income and half have a lower net income. The average median net farm income in 2021 was +$176,426.
A total of 1,584 farms from throughout South Central, Southwest, Southeast, and West Central Minnesota were included in the 2021 FBM Summary. The average farm size was 659 acres. The top 20 percent net income farms averaged 1,611 acres, while the bottom 20 percent net income farms had 180 acres.
59 percent of the farm operations were cash crop farms, 14 percent were single entity livestock operations, with the balance being various combinations of crop, livestock, and other enterprises.
410 farms (26%) were under $250,000 in gross farm sales in 2021; 326 farms (21%) were between $250,000 and $500,000 in gross sales; 399 farms (25%) were between $500,000 and $1 million in gross sales; and 449 farms (28%) were above $1 million in gross sales.
In 2021, the average farm business received $58,196 in government program payments, which included two rounds of CFAP payments for crop and livestock producers, some WHIP+ crop disaster payments for 2019, CRP payments and other government payments. In addition, the average farm operation received $8,377 in crop insurance payments, which was about half of the 2020 level of crop insurance payments. The combination of one-time Covid relief payments and crop disaster payments, together with regular farm program payments and crop insurance payments, accounted for approximately 23 percent of the 2021 average net farm income. This compared to 2020, when government payments and crop insurance payments totaled over $126,000 and made up about 74 percent of the average Net Farm Income.
The average family living expense in 2021 was $66,335, which increased slightly compared to recent years. The average non-farm income in 2021 was $46,943, which represents about 45 percent of total annual non-farm expenses by families for family living and other uses.
In 2021, the average farm business spent $1,109,001 for farm business operating expenses, capital purchases, and non-farm expenses. Most of these dollars were spent in local communities across the region, helping support the area’s overall economy.
FARM FINANCIAL ANALYSIS • The average net farm income for Southern and West Central Minnesota for 2021 was $280,900, while the median net farm income for the region was $176,426. This compares to median net farm income levels of $102,848 in 2020, $36,547 in 2019, $20,655 in 2018, $25,377 in 2017, and $33,071 in 2016. As usual, there was large variation in median farm income in 2021, with top 20 percent profitability farms averaging a net farm income of +$620,678, and the low 20 percent profitability farms with an average net farm income of only +$12,706.
The variation in median net farm income in 2021 also tracked very closely with the gross farm receipts of farms. Farms with $1 to $2 million in gross receipts had a median net farm income of +$401,268, compared to +$243,803 for farms with a gross of $500,000 to $1 million, +$136,300 for farms with a gross of $250,000 to $500,000, and +$65,398 for farms with a gross of $100,00 to $250,000. Interestingly, when you look at profit margin, the order is reversed, with the $100,000 to $250,000 group at 39 percent profit margin, the $250,000 to $500,000 group at 36% profit margin, the $500,000 to $1 million group at 29% profit margin, and the $1 to $2 million group at 27% profit margin.
The average farm business showed a significant improvements in the working capital in 2021, compared to 2020, with a large increase in average working capital ($454,239 in 2021 from $295,493in 2020), a significant increase in the current ratio (247% from 198%), and a large increase in the working capital to gross revenue ratio (41% from 32%) The working capital had declined significantly and was a major concern for many farm operations prior to 2020, before showing significant improvement.
Another measure of the “financial health” of a farm operation is the “term debt coverage ratio”, which measures the ability of farm operations to generate adequate net farm income to cover the principal and interest payments on existing real estate and term loans. If that ratio falls below 100%, it results in farm operators having to use to use working capital or non-farm income sources to cover the difference. The average term debt coverage ratio for 2021 was at the healthy level of 389%, which compares to average ratios 274% in 2020, 148% in 2019, 91% in 2018, 102% in 2017, and 90% in 2016. However, the low 20 percent profitability farms had a term debt coverage ratio of only 109% in 2021.
Any additional cash flow dollars over and above the term debt principal and interest payments that are earned by farm operation are available for machinery replacement or other capital improvements. In 2021, the average farm had $218,132 available for those purposes, while top 20 percent profitability farms had over $675,000 available. This helps explain the strong demand for farm machinery, upgrades to grain handling systems, and other farm and non-farm upgrades that has occurred in the past couple of years.
BOTTOM LINE Overall, net returns from both crop and livestock operations were much improved for most farm operators in 2021; however, as usual there was a wide variation in farm profit levels from the top one-third of net farm income operations as compared to other farms. The overall average financial health of many farm businesses improved significantly in 2020 and 2021, after declining for several years due to low profit levels. Farm profit levels remain favorable for 2022; however, there are some “caution flags” on the horizon. These include rapidly increasing input expenses and land costs, potential future declines in grain and livestock market prices, and likely lower levels of government payments. Complete farm management results are available through the University of Minnesota Center for Farm Management FINBIN Program at: http://www.finbin.umn.edu/
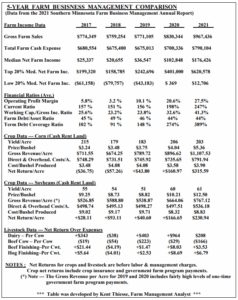
(Note — Please refer to the attached Table for a 5-year (2017-2021) comparison of various average farm financial data.)
*************************************************************************************
Note — For additional information contact Kent Thiesse, Farm Management Analyst and Sr. Vice President, MinnStar Bank, Lake Crystal, MN. (Phone — (507) 381-7960) E-mail — kent.thiesse@minnstarbank.com) Web Site — https://minnstarbank.com/